How much does the public sector spend in the United States each year? And what does the public sector spend it on? As a federal country with a decentralized, multi-level public sector, an analysis of intergovernmental finances—accounting for spending at the federal, state and local government levels—is needed in order to meaningfully answer basic questions about public sector spending in the United States. While it is relatively easy to quantify and analyze the federal government’s spending in key policy areas on an annual basis using federal budget data, comprehensive data on state and local government finances is collected only once in every five years by the Census Bureau as part of the Census of Governments. The most recent data for state and local government finances (for 2017) was released in November 2019. Based on these data sources, the current note explores the intergovernmental aspects of public expenditures in the United States—generally considered the first “pillar” of intergovernmental finance—by considering how much governments spend at each level in the United States, and what governments at each level spend their resources on.
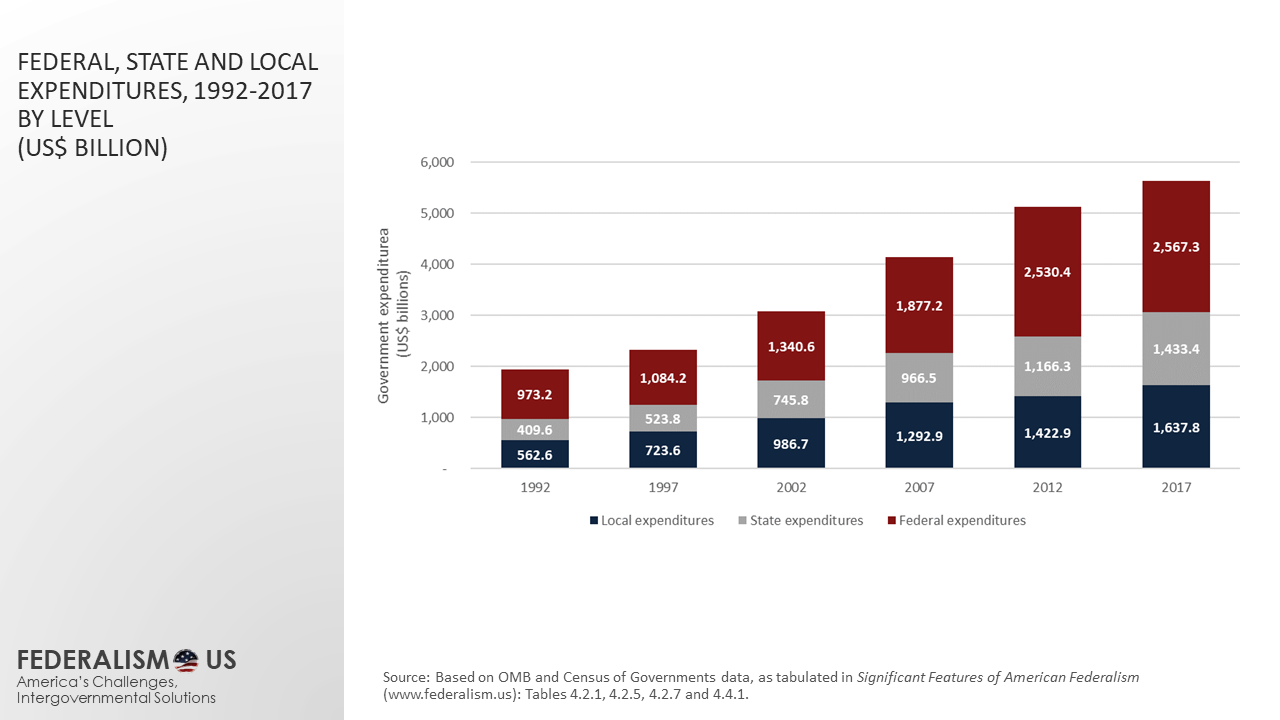
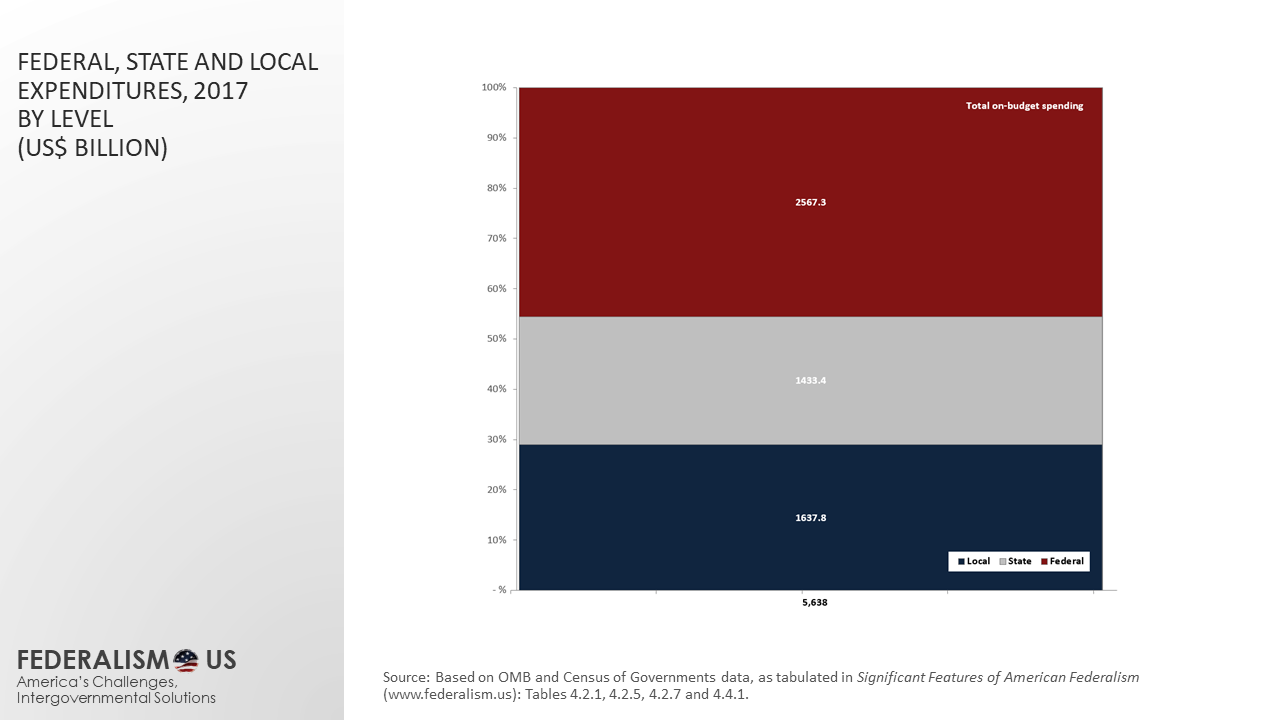
A brief institutional context Federal, state and local governments have important roles to play in how we, as a country, provide for the common defense, establish justice, and promote the general welfare. Where individual actions and private markets fail to achieve collective ambitions, federal, state and local governments step in by constructing public infrastructure and providing public services. The framework for what each government level spends on—and ultimately, how much they spend—is provided by the assignment of powers and functional responsibilities in the U.S. Constitutions and in the respective state constitutions. The U.S. Constitution (Article I, Section 8) states that “The Congress shall have Power To … provide for the common Defence and general Welfare of the United States” and assigns a list of specific powers and functions to the federal government, including the power to regulate commerce, to raise and support armies, and to establish post offices and post roads. In turn, the Tenth Amendment limits the powers and functions of the federal government by stating that “[t]he powers not delegated to the United States by the Constitution, nor prohibited by it to the states, are reserved to the States respectively, or to the people.” State constitutions form the foundation for the spending powers of state and local governments in each of the respective states. Although the distribution of functions and spending responsibilities between state and local governments is relatively similar in many states, there are also important variations between different states in the functions assigned to the local government level. How much does government (at the federal, state and local level) spend? In 2017, the latest year for which accurate, comparable data are available for all government levels, the public sector in the United States spent 5.6 trillion dollars. This is up from 1.9 trillion dollars in 1992; 3.1 trillion in 2002; and 5.1 trillion in 2012. Of the total amount of public spending in 2017, over 2.6 trillion dollars (or about 45 percent) was spent by the federal government. In addition, state governments together spent 1.4 trillion dollars (roughly 25 percent), while local governments accounted for 1.6 trillion dollars (30 percent) in public spending. Two data caveats should be noted. First, the spending figures cited here include only regular (or “on-budget”) government expenditures. As such, expenditures from the social security trust fund and other extra-budgetary expenditures are excluded. Second, the spending figures cited here include only direct expenditures at each government level. Intergovernmental expenditures—transfers of money from one government level to another—were removed from the spending figures at each level in order to avoid double-counting.
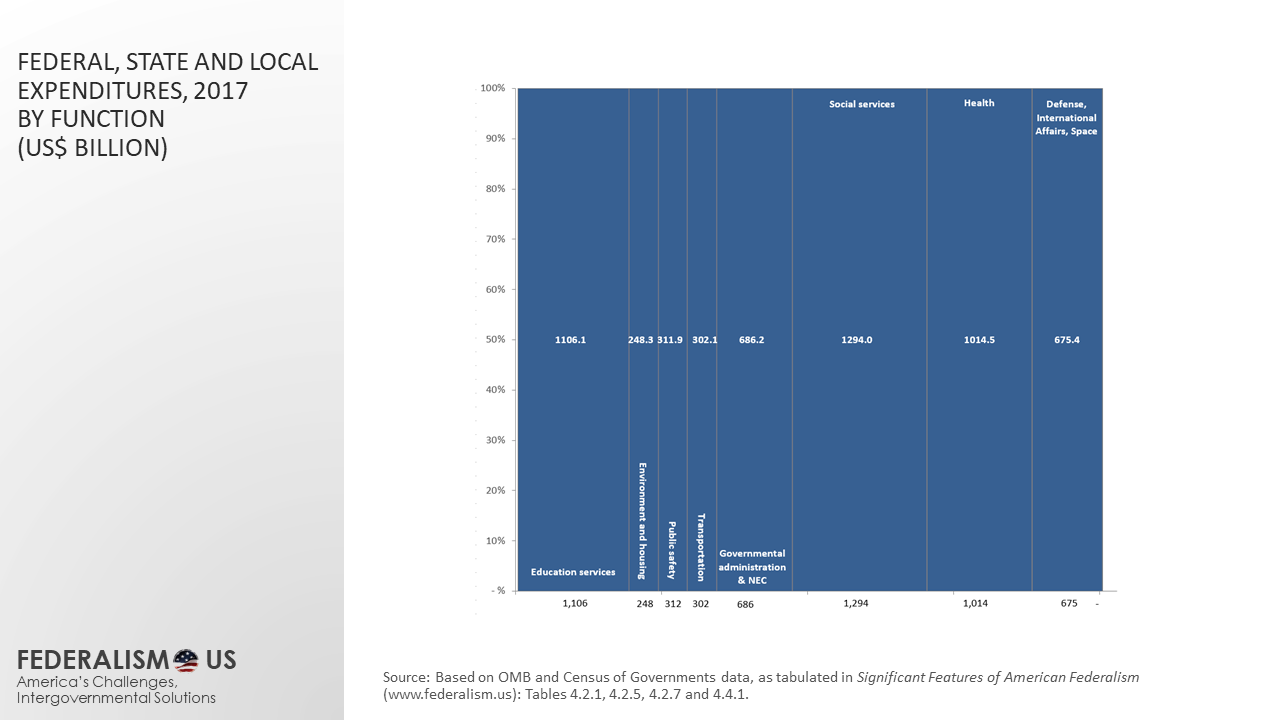
Government spending by function When government spending is aggregated by function across all government levels, the biggest spending category is social services and income maintenance (1,294 billion dollars), followed by education (1,106 billion dollars) and health 1,014 billion dollars). In this functional breakdown, the smallest expenditure category is environment and housing (248 billion).
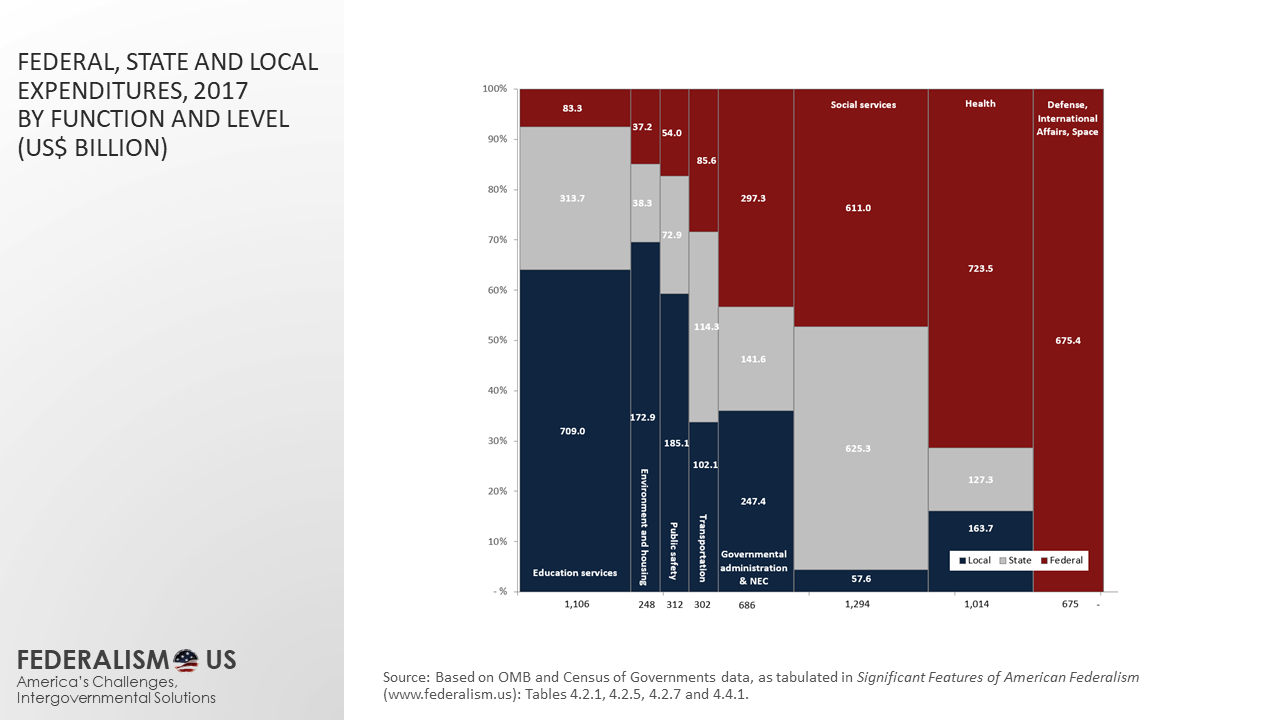
How much does each government level spend on each function? Federal, state and local government expenditures are divided quite unevenly across different government functions or sectors: whereas national defense is exclusively funded by the federal government, other functional categories—such as education, environment and housing, and public safety are predominantly funded by state and local governments. The level and composition of federal, state and local government expenditures becomes more relatable when the amounts are expressed in per capita terms. On average, total public spending across all government levels (federal, state and local) amounted to 17,350 dollars per person in 2017.[1] The functional area that has relatively the least federal government spending is education: out of the 3,403 dollars of public sector spending on education per person in 2017, the federal governments only contributed 256 dollars per person in direct education spending. Instead, the vast majority of direct education spending—2,182 dollars per person—was done by local governments. Similarly, the majority of spending on environment and housing programs as well as on public safety takes place at the local level. Other functions reflect more balanced spending across government levels. For instance, federal, state and local governments all contribute significantly to transportation spending, which includes federal and state highways, along with local roads, public transit and other transportation infrastructure. In turn, expenditures for social services and income maintenance programs largely take place at the federal and state levels, whereas the majority of health expenditures are made by the federal government.
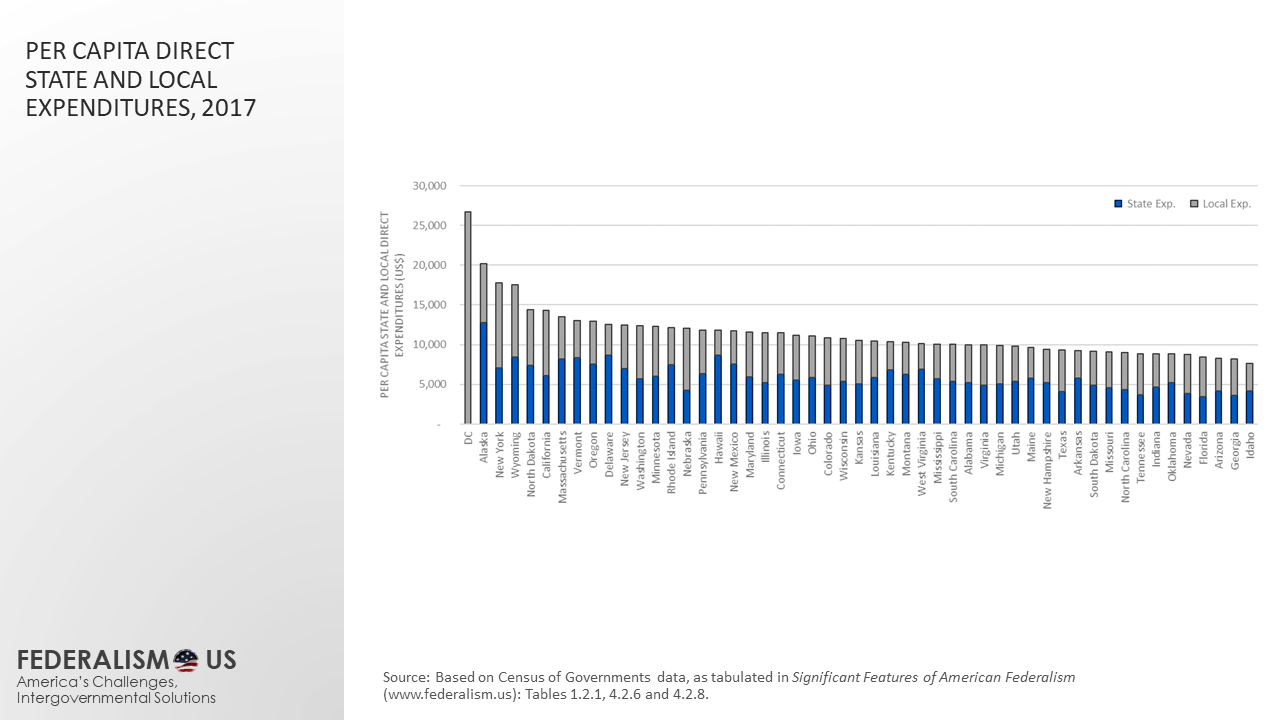
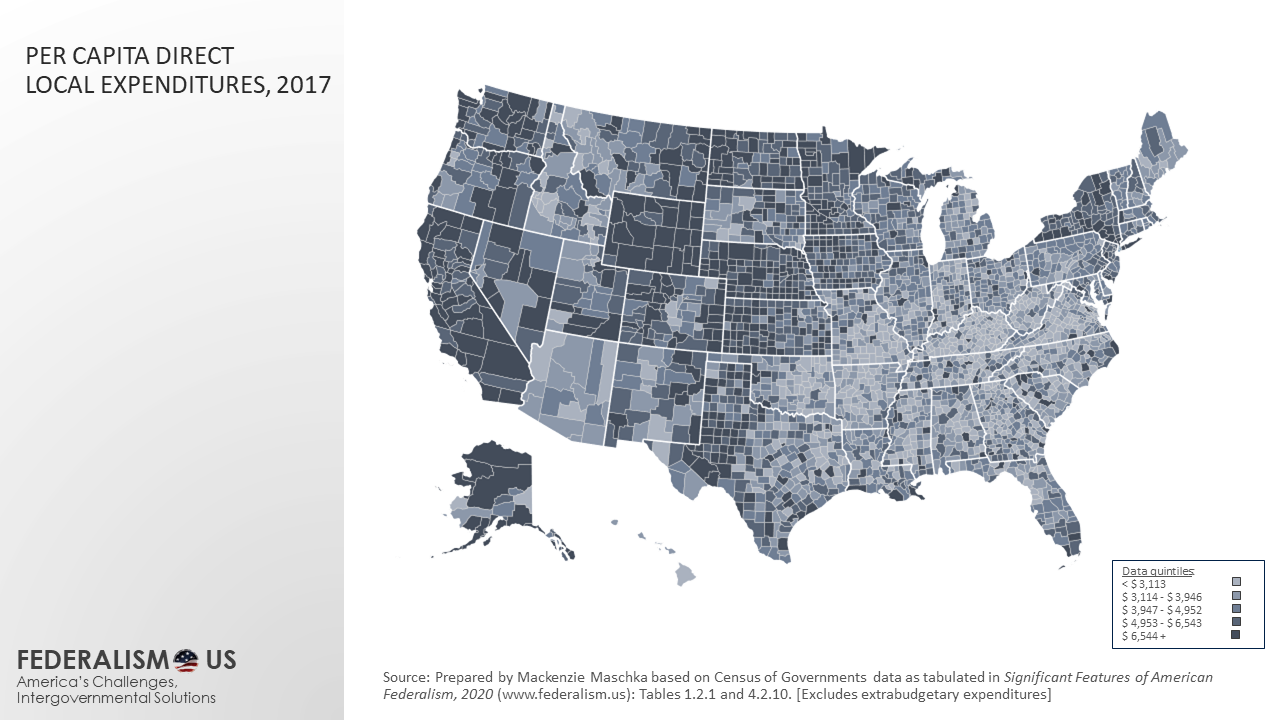
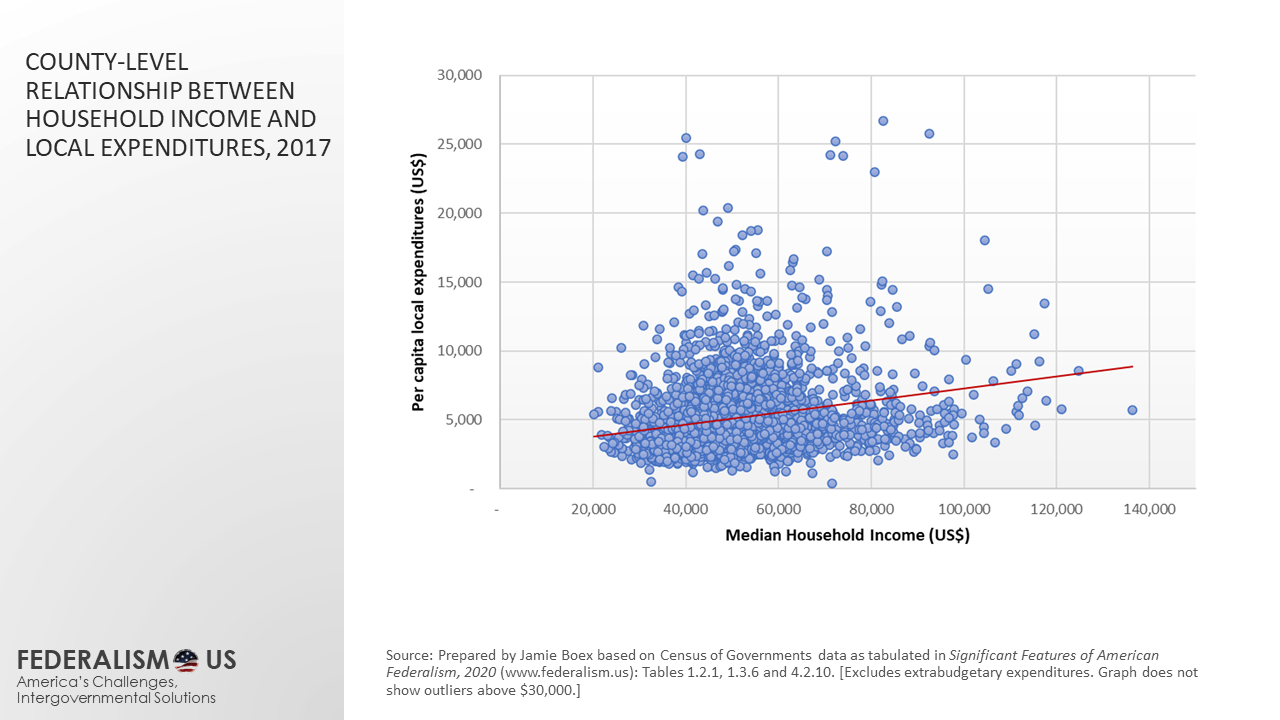
Distribution of state and local expenditures across states and localities It is important to recognize that these federal, state and local spending levels reflect national averages. In reality, spending levels vary considerably across state and local governments. For instance, even though state and local governments on average spend 4,410 dollars and 5,040 dollars per resident, respectively, these spending amounts vary considerably from state to state. State and local expenditures (combined) exceeded 17,500 dollars per capita in the District of Columbia, Alaska, New York and Wyoming, while Florida, Arizona, Georgia and Idaho spent less than half of that amount (i.e., less than 8,750 dollars per person) in 2017. Generally, local governments that have a greater revenue base and/or a higher demand for public services (as proxied by household income levels) tend to engage in higher levels of public expenditure. In addition, it is likely that state and local government jurisdictions that face higher service delivery costs tend to engage in higher expenditures as well.
Why is the intergovernmental lens important? The overview of federal, state and local governments suggests that analyzing public expenditures by looking at spending one government level at a time would provide an incomplete and skewed view of public expenditures. For instance, looking exclusively at the federal budget would leave the impression that defense is a major share of public spending, while suggesting that education spending only reflects a small share of public spending in the United States. However, a comprehensive, intergovernmental view of public expenditures provides a much more balanced view of the relative proportion of public spending on education and other functions, by taking into account public sector spending for each function at all governments levels. It is further important to analyze state and local government spending in an appropriate intergovernmental context in order make sure that the analysis compares apples with apples. For instance, local government spending (per person) in Hawaii is the lowest among all states—in part due to the fact that elementary and secondary education are provided and funded directly by the state rather than by local governments. Similarly, local government spending (per person) in New York State is the highest among all states—in part as a result of the fact that counties in the state have significant public welfare responsibilities (whereas this is almost exclusively a state-level function in most other states). Finally, recognizing public expenditures in an intergovernmental context highlights the tremendous opportunities for intergovernmental cooperation and collaboration. For instance, in the area of transportation (including highways, public transportation and other transportation infrastructure), the federal government could either choose to “go it alone”, or it could establish effective intergovernmental relations with state and local governments—which spend over 215 billion dollars each year on road construction and other transportation. By working across government levels, the federal government is able to focus on what it’s good at (national coordination and distributing resources), while leveraging the strengths of state and local governments (greater responsiveness and accountability) to make sure highways and roads are properly constructed and maintained, so that people and goods can move quickly and efficiently from coast to coast. A final caveat An important caveat was noted earlier regarding the analysis of direct public expenditures that bears repeating: direct expenditures do not reflect the total expenditure amounts at each government level, as direct expenditures do not include grants-in-aid or other types of intergovernmental expenditures made by each level. Intergovernmental expenditures (or intergovernmental fiscal transfers) reflect a considerable share of spending at the federal and state government levels. The size and impact of intergovernmental fiscal transfers in American federalism is analyzed as a separate pillar of intergovernmental finance.
Jamie Boex – October 2020. Jamie Boex (jamieboex@gmail.com) is a Fellow of the National Academy of Public Administration.


Slots Empire is your perfect choice for online entertainment! Enjoy exciting games and the chance to win huge sums of money. Join us now at Slots Empire Casino!