It is difficult to conceptually measure the degree of “local democracy” in any state or country. It is even harder to measure local government representation in the United States in practice, as little systematic data are available regarding the basic features of local democracy, such as the number of elected local representatives across the U.S.. The last time comprehensive data were published regarding the number of popularly elected officials in the United States was over a quarter century ago as part of the Census of Governments in 1992.
Nonetheless, based on these data, an exploratory analysis of the State of Local Democracy in the United States (July 2018) provides important insights into the state of local democracy, finding that:
“[t]he degree of electoral representation in the United States appears to be quite reasonable, with each elected local representative on average representing the voices, opinions, and perspectives of residents of around 6,600 residents. Elected representation, however, is quite unevenly distributed across states: whereas some states have a high degree of electoral representation (with 1,000-3,000 constituents per elected local representative, on average), local governments in other states have much lower degree of democratic representation (exceeding 30,000 residents per elected local representative).”
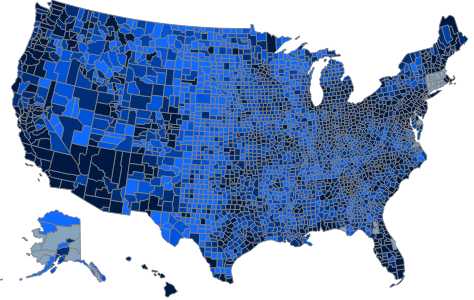
The exploratory analysis finds similar results for county-level local governments. Whereas, on average, 18,706 residents are represented by an elected representative at the county level, the level of representation varies considerably from state to state, ranging from roughly 3,000 residents per elected county representative in South Dakota, Wisconsin and North Dakota to over 100,000 residents–on average–per elected county representative in Arizona and California.
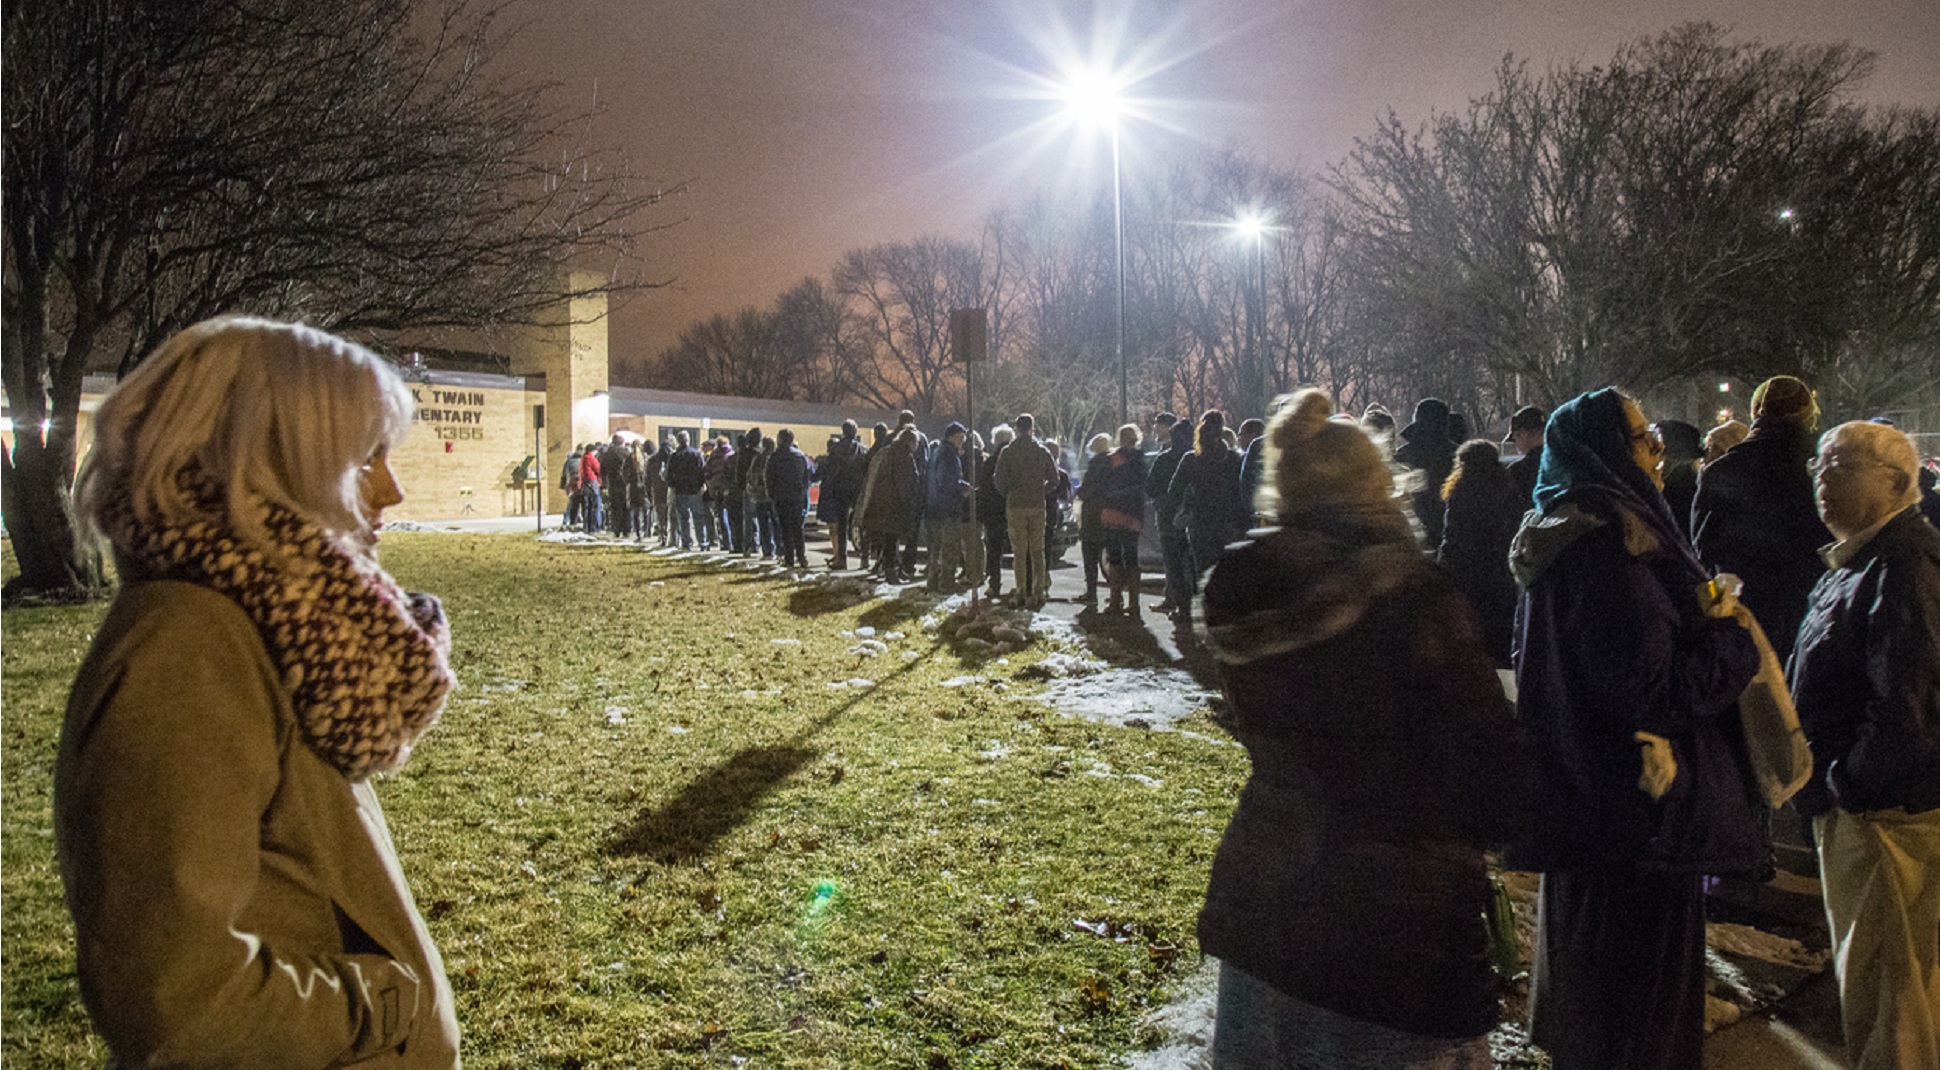
This level of representation may be a cause for some concern, as having to stand in line with 18,000 other residents in order to get your voice heard does not sound like the hallmark of a participatory, responsive and accountable local democratic system. On the positive side, however, residents do not exclusive rely on county governments: instead, they often receive services from municipal governments and school districts that are more representative than the county level.
New evidence. In an effort to move towards a more updated and granular analysis of the state of local democracy at the county level, we extracted information on county-level elected local officials across the United States from an online data set prepared by the National Association of Counties (NACo).
Analysis of the more recent NACo data set confirms that the levels and variation of elected county representation have changed little over the previous 25 years. Based on a preliminary analysis of the NACo data set, county-level electoral representation in the United States currently averages 17,000 residents per elected representative. Relying on the new data set, the variation in county-level electoral representation identified across states is nearly identical as the earlier analysis.
In addition, the NACo data set provides insight into the variation of county-level local elected representation within states. Within California, for instance, there is huge range of county-level democratic representation: whereas a County Supervisor in Alpine County, California, on average represents 214 residents, a County Supervisor in Los Angeles County on average represents over 2 million residents.

Perhaps as expected—given that the size of county boards vary little across counties in most states—, the data show that county-level local elected representation is very highly correlated with county population size: over 85 percent of the variation in county-level local representation in the U.S. can be explained by the size of a county’s population (i.e., r=0.926).
This underlying pattern means that, overall, states with more populous counties (i.e., more urbanized counties or geographically larger counties) tend to have considerably less democratic representation at the county level than more rural or smaller counties. Although residents of more populous counties are more likely to rely on sub-county local governments (i.e., city governments or municipalities), no current data are systematically available on democratic representation below the county level which would allow us to quantify or confirm this relationship. Furthermore, just because there may be greater democratic representation below the county level does not preclude the county government itself from becoming more democratic.
In fact, analysis of the NACo data set suggests that two-thirds of the American population lives in a county where each individual county board member represents an average of over 30,000 residents. This is a significant threshold because Article I, Section II, of the U.S. Constitution deems that this is an appropriate threshold for democratic representation at the federal level; presumably state and local governments—being closer to the people—should have a (much) higher degree of democratic representation than this.
Policy implications. What are the policy implications of these current findings?
Most obviously, these results suggest that it would be appropriate to increase the level of democratic representation at the county level, either by increasing the number of counties in the United States (as was common in the earlier years of the republic) and/or by increasing the number of members of elected county governing bodies.
In doing so, it would be most appropriate to focus on the pursuit of greater equity in democratic representation at the county level. This could be accomplished, for instance, by state legislatures tying the size of county boards or assemblies to the size of county population.
