
The educational opportunities available in a community, both in and out of school, are reflected in students’ average test scores. These test scores are influenced by opportunities to learn at home, in neighborhoods, in child-care, preschool, and after-school programs, from peers and friends, and at school.
Racial, socioeconomic, and gender disparities in academic performance and educational attainment are stubborn features of the U.S. educational system. These disparities—which are the result of a range of social and economic policies, social norms and patterns of interaction, as well as the organization of American schooling—are neither inevitable nor immutable.
The Stanford Education Data Archive (SEDA) is an initiative aimed at harnessing data to help scholars, policymakers, educators, and parents learn how to improve educational opportunity for all children.
Earlier this month, the Educational Opportunity Project (EOP) at Stanford University released the latest version of the Stanford Education Data Archive (SEDA). SEDA includes a range of detailed data on educational conditions, contexts, and outcomes in school districts and counties across the United States. It includes measures of academic achievement and achievement gaps for school districts and counties, as well as district-level measures of racial and socioeconomic composition, racial and socioeconomic segregation patterns, and other features of the schooling system.
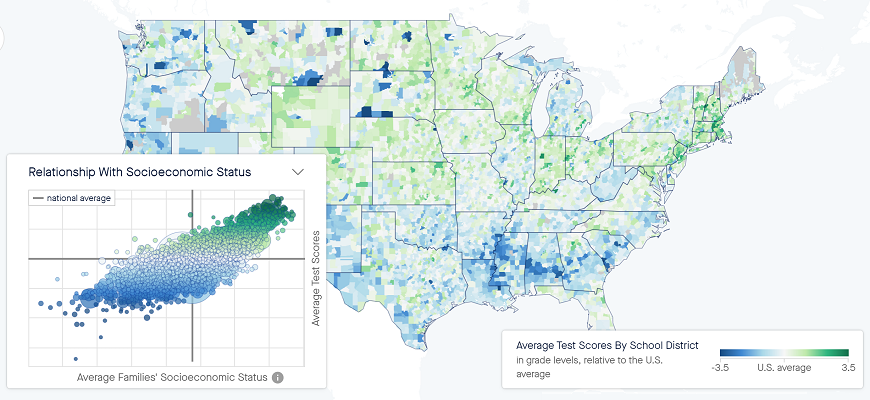
The data are publicly available, so that anyone can obtain detailed information about American schools, communities, and student success. These data show strong disparities between different school districts, and find a strong correlation between socio-economic status and learning outcomes.
Careful analysis, however, can reveals nuanced stories about how schools contribute to educational opportunity. In fact, SEDA data suggests that affluent schools are not always the best schools. For instance, the Chicago Public Schools are more successful than they are given credit for. In 3rd grade, where our test-score data begin, the average student in Chicago scores below a 2nd-grade level, as shown in the accompanying chart.
The left-hand-side of the figure highlights the relationship between how rich a district is and how its students perform on standardized tests in 3rd grade. The horizontal axis shows the average family socioeconomic status (SES) in the district, where 0 represents the SES of the average district in the United States. More affluent districts are located to the right in the figure; poorer districts to the left.
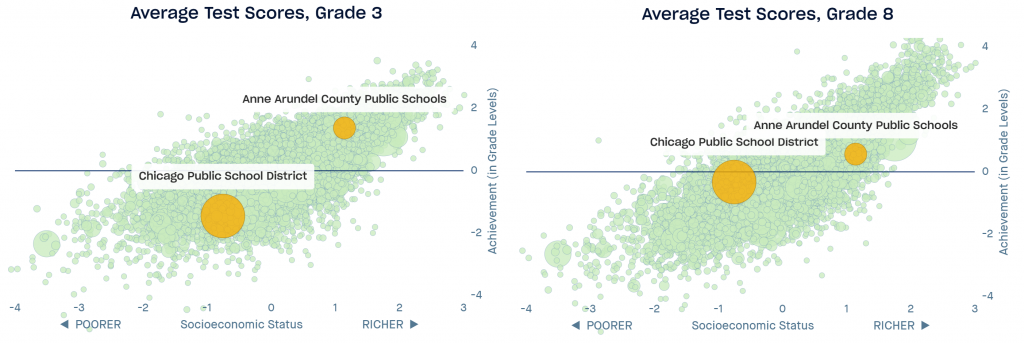
In many ways the pattern shown here is not surprising: children’s scores are much higher in richer districts. For example, in relatively affluent Anne Arundel County, Maryland, average test scores are well above average in 3rd grade. In Chicago, by contrast, scores are far below average, but by 8th grade, Chicago students perform near the national average (as shown on the right-hand-side of the figure). They have experienced the equivalent of six years of average learning in the five years between 3rd and 8th grade. The families in Chicago’s public schools tend to be lower in socioeconomic status, and the average test scores are relatively modest, but, year after year, the schools are lifting children up at an impressive rate.
In Anne Arundel, the opposite is true. Although students there are more affluent than average and score above a 4th-grade level in 3rd grade, they learn at a far lower rate than their Chicago peers. By 8th grade their scores are only slightly above average.
The Educational Opportunity Project provides this data—the “learning rate”—for schools, school districts, and counties across the country. The result is an unexpected story of the quality of public education in the United States. While students in some relatively affluent districts—like Anne Arundel County—show less progress as they move from one grade to the next, the data also suggest that students in some poor districts start off testing far below average, but that the schools appear to be doing an outstanding job, where students are catching up to and exceeding the national average.
Learn more by visiting the Education Opportunity Project website.