

Coronavirus Relief Funds (CRF) and State and Local Fiscal Recovery Funds (SLFRF) have provided financial lifelines to state, local, tribal, and territorial (SLTT) governments facing the dual challenges of a steep, if temporary, decline in revenues and an increase in spending on public safety and health. As part of the CARES Act, CRF provided $150 billion in support, to be spent or obligated by December 31, 2021. Through the SLFRF, SLTT governments will receive $350 billion in aid by mid-2022.
The SLFRF requires SLTT governments to submit recovery plans to the Treasury Department detailing their planned and actual spending of pandemic relief funds. Most states have made their recovery plans available, but they primarily demonstrate compliance with Treasury reporting requirements rather than communicate decision making to the public.
SLFRF dashboards use data visualizations to communicate the key elements of recovery plans and related spending. The sites range in format, scope, and interactivity, making comparisons across government units difficult.
Below is a selection of state and local government dashboards that illustrate a wide range of approaches. These sites combine SLFRF, CRF, and other American Rescue Plan program expenditures.
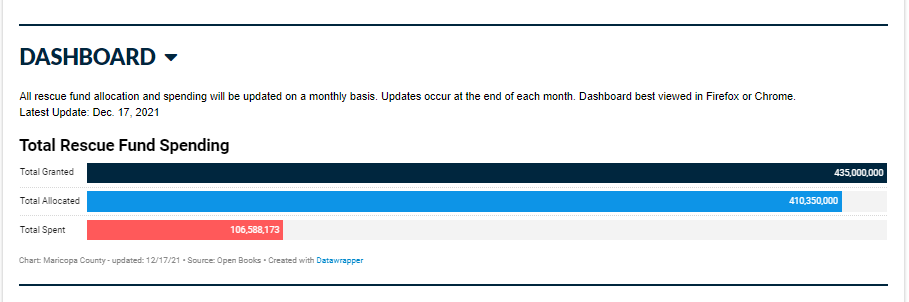
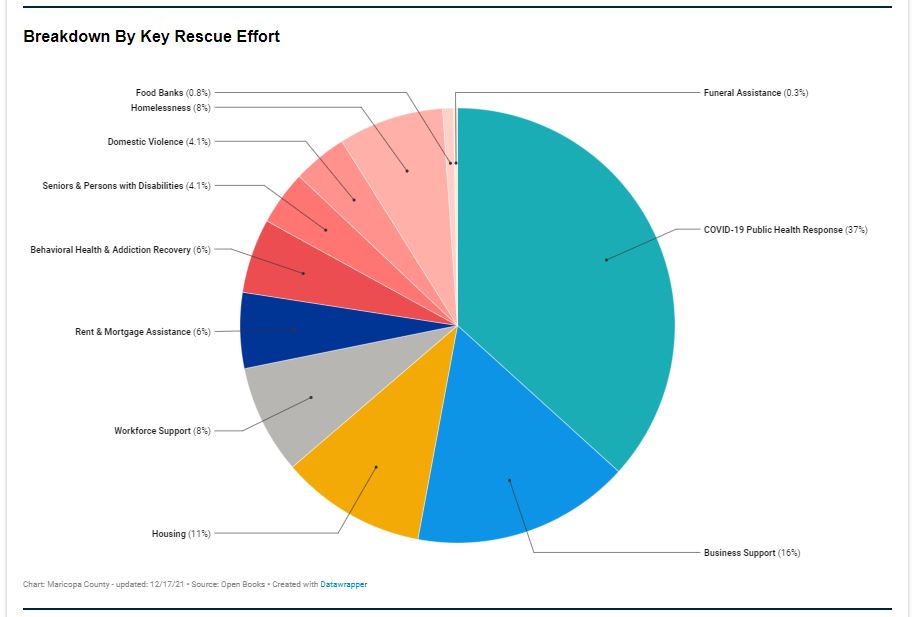
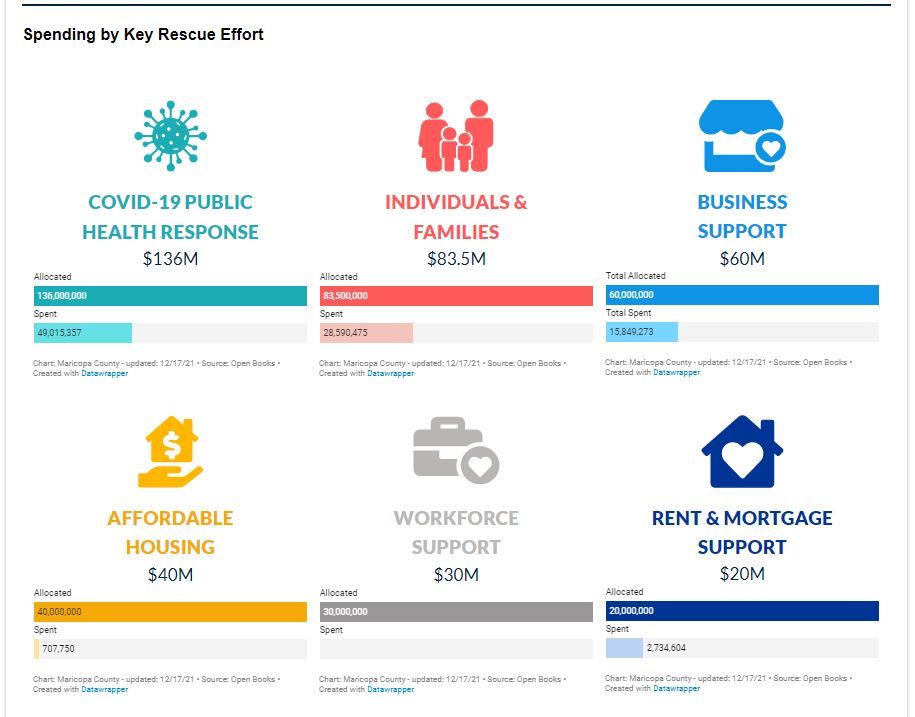
Maricopa County offers a single, easy-to-read summary of American Rescue Plan funds. A separate page summarizes their CARES Act funding.
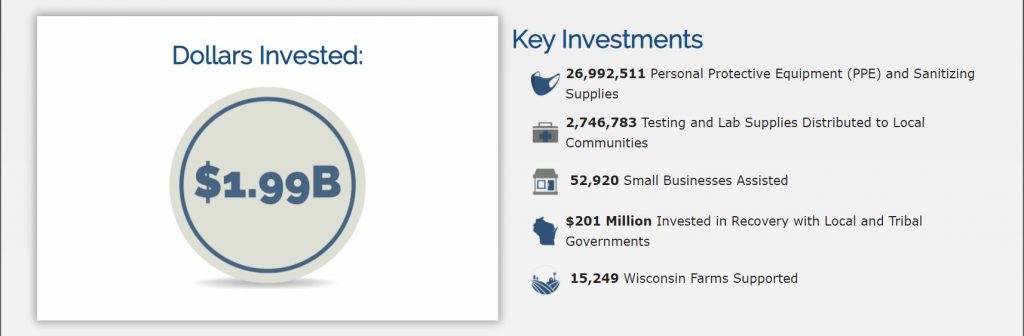
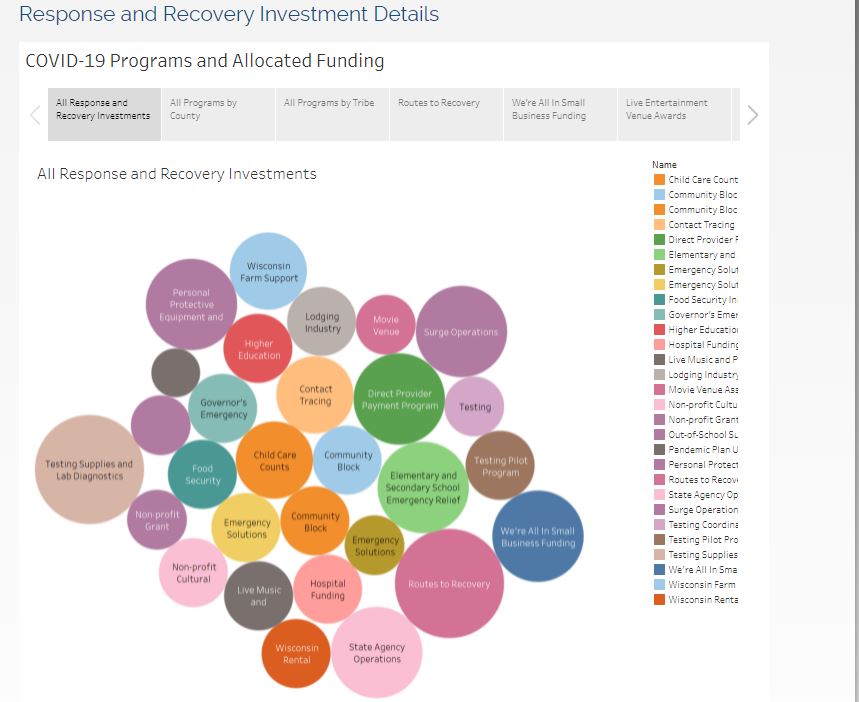
Wisconsin highlights “key investments,” followed by aggregate data. Tabs (not shown below) display spending categories by the program.
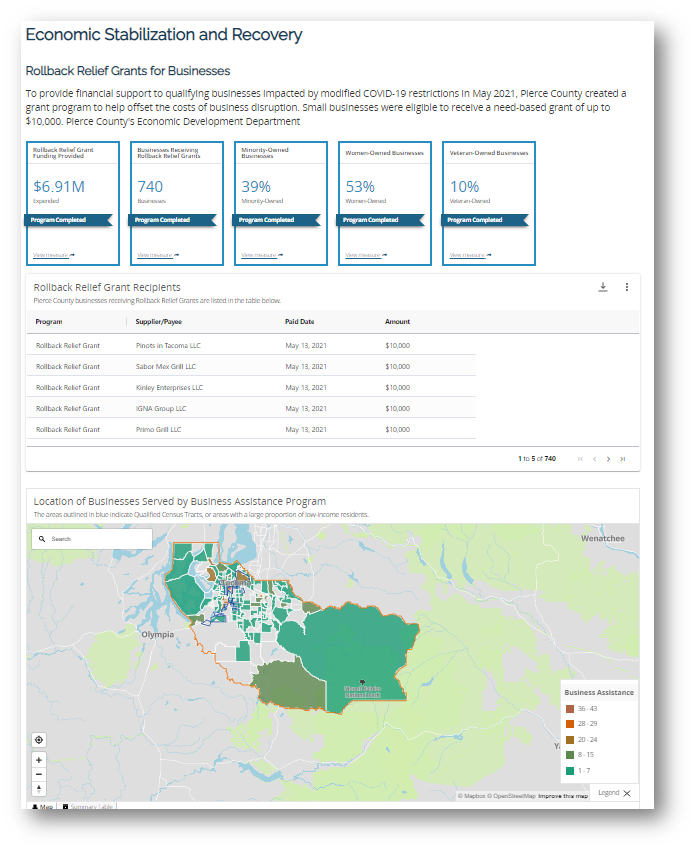
Pierce County (WA) presents separate dashboards by the program. Below is the dashboard for economic stabilization, displaying impact, a list of recipients, and a map showing recipients’ locations.
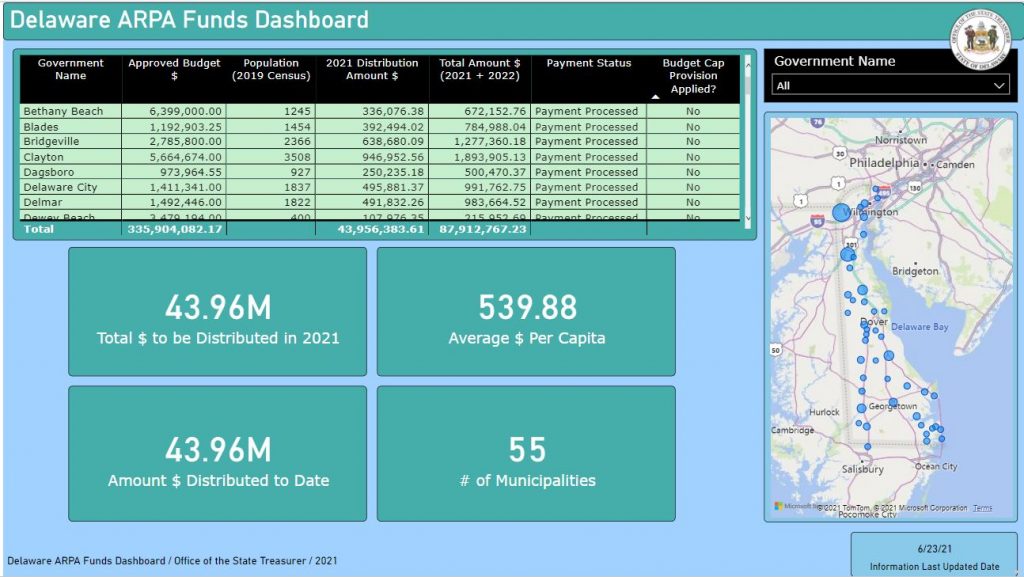
The Delaware ARPA dashboard lists allocations for every local government. The map on the right is interactive; clicking on a locality displays additional detail.
For Further Reading:
In August 2021, Academy Fellows Katherine Barrett and Richard Greene wrote about states’ and large localities’ efforts to provide useful online information on their planning, spending, and coordination of COVID relief funds.
A group of university researchers in Ohio assessed the COVID trend reporting of state health-related dashboards. The findings are behind a paywall, but the abstract explains that most states achieved CDC objectives to display data. The evaluation criteria and links to all states’ dashboards are available