

This is a repost from Brookings written by Jenny Schuetz, Tim Shaw, Katherine Lucas McKay, and Genevieve Melford. You can access the original piece here.
Local elected officials have a lot on their plates. They oversee a wide range of policy areas, from schools and criminal justice to water infrastructure and economic development. Large cities and counties may have specialized departments that oversee these policy domains, staffed by civil servants with extensive training in their fields. But many small localities have limited resources—both money and staff—to provide guidance and policy recommendations. In developing a strategy to tackle local problems, there is a tendency to observe and replicate what neighboring cities or counties are doing—which may or may not be the right approach. Underlying housing market conditions can vary widely even across neighboring localities.
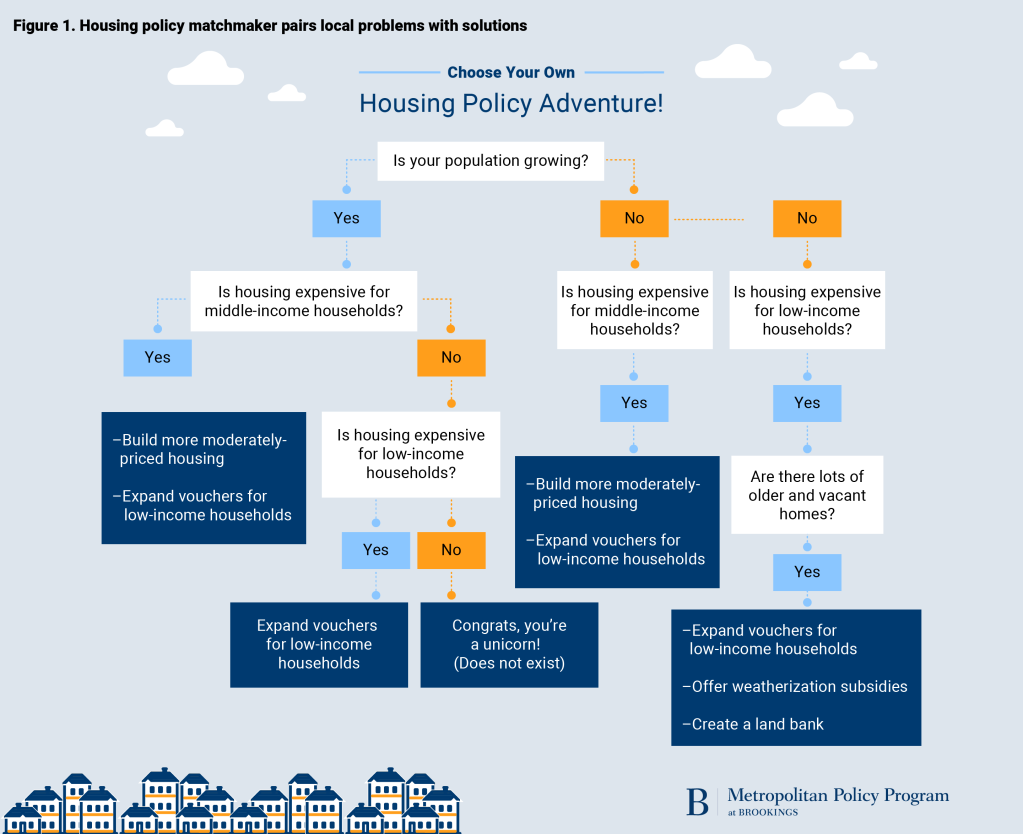
The housing policy matchmaker is intended for local leaders who know that their community faces housing problems but are not sure what is causing them or how to solve them. It is designed to help policymakers diagnose the health of their local housing market, understand key challenges, and develop a broad outline for the types of policies that address those challenges. It provides local governments with a concise, accessible snapshot of housing conditions, focusing on a handful of key metrics, and places the locality in context relative to neighboring communities. The matchmaker does not provide a detailed implementation plan, narrowly customized to each locality. To use a medical analogy, the matchmaker serves as a triage assessment that can refer local officials to the appropriate treatment or specialist: It points policymakers in the right general direction and provides links to other resources that offer detailed information on different policy tools.
Figure 1 shows a simplified illustration of the matchmaker concept, highlighting key policy recommendations for four common types of local housing markets. (In reality, counties can have multiple different problems that require a combination of policy tools, not as neatly separated as the diagram.)
The matchmaker begins by developing a simple typology of local housing markets that places each locality in a big-picture context, based on population growth and housing costs. We then highlight the four components of the matchmaker for a set of communities that represent different market types. Our analysis uses counties as the unit of geography, but the methods could easily be applied to cities and towns, or even neighborhoods within a large city. To date our analysis covers counties within metropolitan areas, because the housing market dynamics and policy tools differ somewhat between urban and rural communities.
Typology of local housing markets: Population growth and housing affordability
We use two simple metrics to categorize local housing markets. The first metric, change in population, addresses underlying demand: Does a community have enough homes to meet demand? Communities that have a growing population will need to build additional housing to accommodate demand, while communities with stable or declining populations will be more concerned with maintaining the quality of existing homes. (Some communities have strong underlying demand but little population growth, because they have not allowed housing stock to increase.) The second metric describes affordability: how expensive is housing in the community relative to incomes? Specifically, we calculate the ratio of median housing values in each county to median household income for the surrounding metropolitan area. This metric acknowledges that households sort across communities by income; high-priced counties may look affordable to the wealthy households who currently live there, while being out of reach for typical households in the larger metro area. This phenomenon means that while within-county data may show that it is affordable to current residents, the costs of its housing market could constrain housing affordability for residents across the metropolitan area. More details on variable definitions and data sources are provided in the methodology appendix.
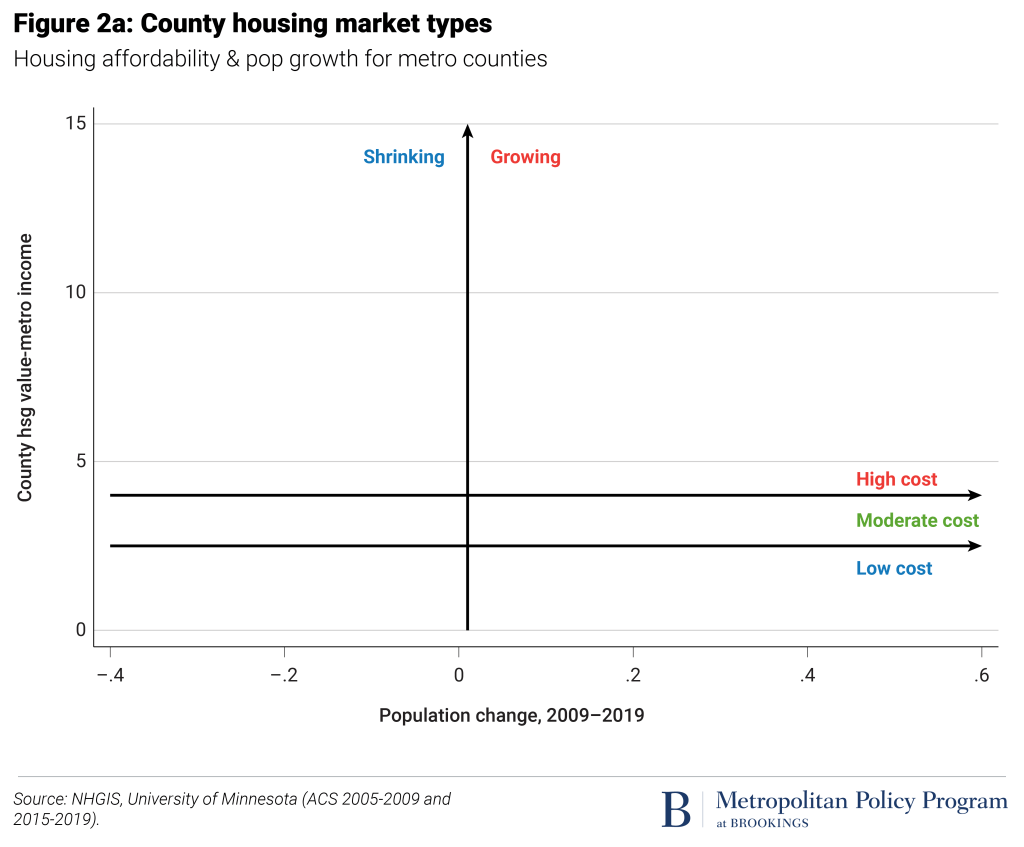
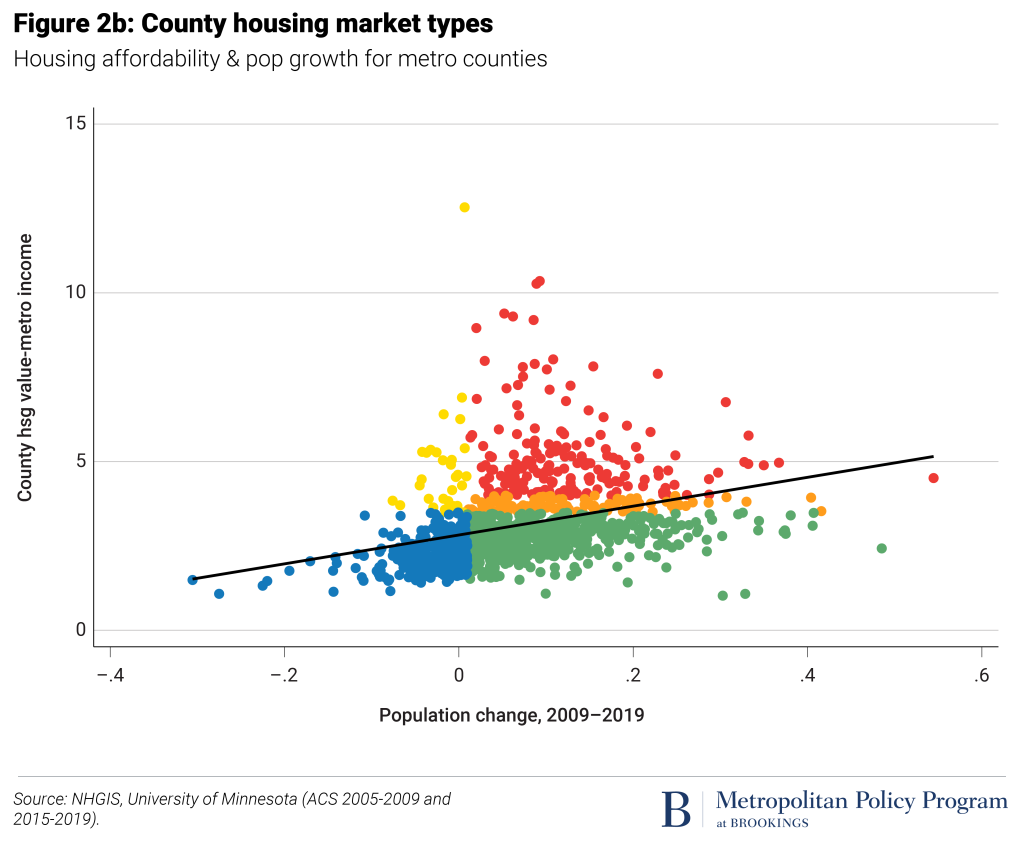
Urban economic theory predicts that population growth and housing costs should be positively correlated. Places with well-paid jobs, good schools, and other local amenities will attract more residents. People are willing and able to pay more for housing in opportunity-rich places. Graphing county population change and housing value-to-income ratios indeed shows a strong positive relationship between these metrics (Figure 2). To match counties with appropriate policy solutions, we define five housing market categories, grouping counties with similar underlying conditions. These are:
- High-cost and growing (red)
- Moderately-high cost and growing (orange)
- Low-to-moderate cost and growing (green)
- High-cost and shrinking (gold)
- Low-to-moderate cost and shrinking (blue)
Grouping counties into this typology is the starting point for recommending policy choices. In the more detailed tables that follow, we highlight a few other key metrics that point toward specific policies. The next four sections of this report demonstrate how to use the diagnostic tool to match local housing challenges with policy solutions. For each market type, we select one representative county, present and explain key metrics, then suggest a suite of appropriate policy tools.
Every community is unique, but the need for decent-quality affordable housing is universal
Taking stock of a community’s housing market conditions and challenges is a critical first step to developing an action plan. The housing policy matchmaker is intended to provide local elected officials with a concise, accessible snapshot of the top-line housing needs in their community, placed in the context of surrounding communities. The facts contained in each county’s profile can also be useful for local policymakers in discussing needs and goals with voters, industry and non-profit partners, and their counterparts in state and federal agencies.
The recommended policies in the county profiles contain links to more information on each type of tool. Policymakers looking for greater detail on economic and demographic conditions or implementation guides should check out resources such as the Local Housing Solutions network and the U.S. Department of Housing and Urban Development’s Office of Policy Development and Research.
The housing policy matchmaker is intended to help local officials. Recognizing that every county, city, or neighborhood has a unique set of housing market conditions, challenges, assets, and resources, the top priorities will vary across communities. But one problem is apparent in every community: the poorest 20% of households (both owners and renters) struggle to afford decent-quality housing, without sacrificing other necessities. Local governments alone do not have the resources to meet the scale of need: Expanding federal subsidies will be required to meaningfully support poor households.
This is a repost from Brookings written by Jenny Schuetz, Tim Shaw, Katherine Lucas McKay, and Genevieve Melford.