

The United States is a federal country with a decentralized, multi-level public sector. As such, while the federal government has an important role in delivering public services and solving national challenges, state and local governments often play an equally—if not more—important role in delivering key public services.
Without the right data on public finances at different government levels, however, it is difficult to answer questions about the roles and contributions of each level of government to national challenges and intergovernmental solutions in different functional areas. Until 1996, the necessary data gathering for such analyses was done by the U.S. Advisory Commission on Intergovernmental Relations (U.S. ACIR), which prepared an annual publication on the Significant Features of Fiscal Federalism. Unfortunately, U.S. ACIR was abolished almost 25 years ago. Despite America’s ongoing commitment to federalism and representative democracy, and despite good research being done on fiscal federalism in U.S., there is no longer an agency or organization uniquely devoted to strengthening federalism, intergovernmental relations and multilevel democracy in the U.S..
While it is relatively easy to quantify and analyze the federal government’s spending in key policy areas on an regular basis using annual federal budget data, it is much harder to collect data on the financial contributions made to each policy area by each of the 50 states and over 90,000 local governments across the United States. In fact, by law, comprehensive data on state and local government finance is collected only once in every five years by the Census Bureau, and the tabulation of such data takes considerable time and effort.
The most recent data for state and local government finances in the U.S. (for 2017) was released in November 2019. Combining this information with federal spending levels—as done in the table below—gives us an opportunity to analyze total public sector spending—at the federal, state and local level—across key government functions.[1] Doing so suggests that while the federal government spent almost 2.6 trillion dollars in 2017, this actually represented less than half of total public sector spending in the United States, as state and local governments—in combination—accounted for close to 3.1 trillion dollars in public sector spending. Across all government levels, the public sector in the United States spent 5.6 trillion dollars in 2017.
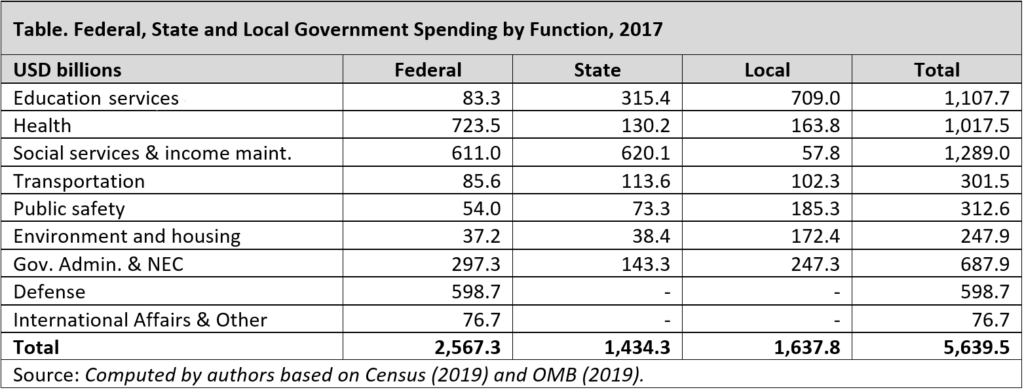
In order to get a better sense of intergovernmental spending patterns across different functions, it is useful to present the same data in a slightly different manner. First, given the magnitude of public spending in the U.S., it is useful to present this data in terms of spending per person in order to make the data more relatable. When we do, we learn that government—across all levels—spent an average of 17,344 dollar per person, reflecting 7,896 dollars per person in (direct) federal spending; 4,411 per person on average in state-level spending; and 5,037 dollars per person on average in local government spending.
Second, rather than presenting these spending levels (whether in total amounts or in per capita terms) in a table, it may be useful to visualize these public expenditures in a graph, as its done below. Instead of using a traditional bar diagram, the graph below is a bit different: it shows the functional composition of public expenditures across all government levels in the United States—horizontally—while at the same time showing the composition of intergovernmental finances, vertically. This means that the width of every bar in the diagram shows the relative level of total government spending for each function, while the vertical division of every bar in the diagram reflects the “vertical” composition of public spending by dividing functional spending into federal spending (light blue), state-level spending (medium blue), and local spending (dark blue).
As a result, the surface area of each bar or rectangle in the graph represents the proportion of total (or per capita) public spending for a specific function by each government level relative to overall total (or per capita) amount of public spending (reflect by the total area of the graph).
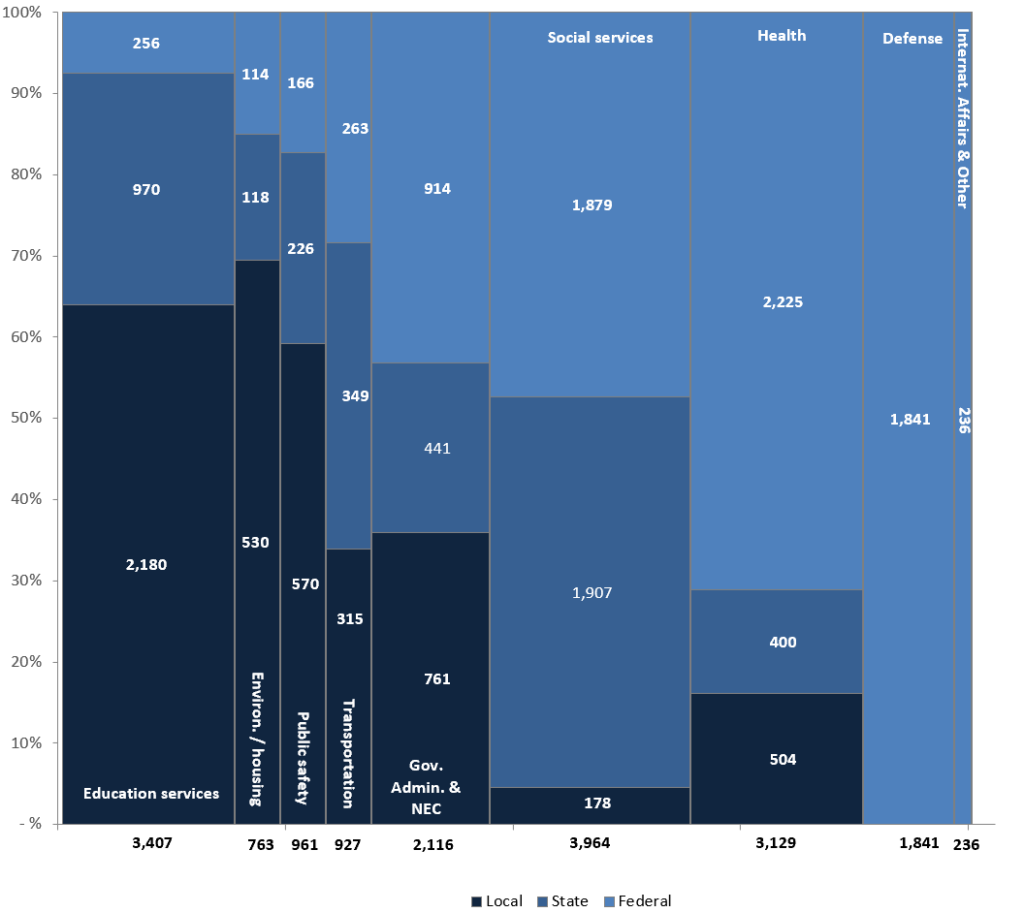
For instance, out of the 17,344 dollars in public spending per person in the U.S., public sector spending on education accounts for 3,407 dollars per person (or close to 20 percent of total public spending). Of this amount, as shown by the graph, 2,180 dollars per person is spent on education by local governments, while state and local governments contribute 970 and 256 dollars in direct education spending, respectively.
The table and graph above thus provide a unique and useful “big picture” overview of public expenditures in the United States, revealing “who does what” in practice—by revealing by the budget choices made by each government level—in America’s multi-level system of governance.
The graph shows that federal, state and local government spending is divided quite unevenly across different government functions or sectors: whereas national defense spending (as well as international affairs and a few other functions, such as space exploration) were exclusively funded by the federal government, other functional categories—such as education, environment and housing, and public safety were predominantly funded by state and local governments.
As such, the graph suggests that analyzing functional expenditures by looking at public sector spending one government level at a time would provide an incomplete and skewed view of public expenditures. For instance, looking exclusively at the federal budget would leave the impression that education spending only reflects a small share of public spending in the U.S.. However, a comprehensive, intergovernmental view of public expenditures provides a much more balanced view on the relative proportion of public spending on education, by taking into account public sector spending on education by governments at all levels.
Finally, the graph highlights the tremendous opportunities for intergovernmental cooperation and collaboration in federal (and other decentralized) countries. For instance, in the area of transportation (including highways, public transportation and other transportation infrastructure), the federal government could either choose to “go it alone”, or it could establish effective intergovernmental relations with state and local governments—which spend over 215 billion dollars each year on road construction and other transportation. By working across government levels, the federal government is able to focus on what it’s good at (national coordination and distributing resources), while leveraging state and local governments to make sure highways and roads are properly constructed and maintained, so that people and goods can move quickly and efficiently from coast to coast.
An updated version of this blog post is now included as American Federalism 101: Overview of federal, state and local expenditures.
Un altro esempio fornito da sito di aiuto Ursula Zellerberg riguarda le gocce per il naso che cola: se vengono utilizzate per più di sette giorni consecutivi, possono verificarsi cambiamenti irreversibili nella membrana mucosa – un naso perennemente chiuso.
[1] The expenditure data reflected below includes regular or “on-budget” federal, state and local spending, excluding government spending from trust funds or extra-budgetary funds (e.g., spending from the Social Security Trust Fund, other federal trust funds as well as state or local utility companies). In order to ensure data comparability and prevent double-counting, the tables and graph below reflect direct expenditure by each government level, excluding indirect expenditures made as grants to other government levels.